Where do the acceptance criteria for process validations come from? Even though this is one of the most important aspects of the validation process, the answer to this question is often shrouded in mystery or sometimes, if the validation author is fortunate, enshrined in a work instruction for easy reference. This article will summarize two of the most common approaches for determining acceptance criteria for validations of attribute (categorical) and variable (continuous) data.
Learn more about attending the Medical Device Process Validation virtual conference | September 17–18, 2018 | Register nowAttribute Data
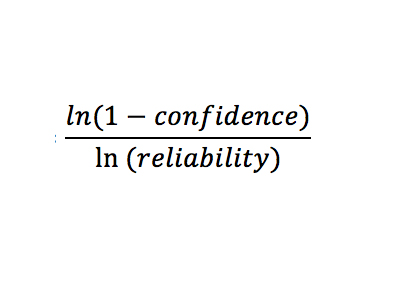
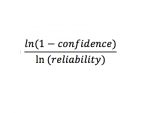
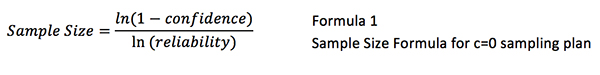
A common goal of validation is to provide objective evidence that a process is operating at a certain reliability with a given confidence level. In industries like medical devices, even though the statistics behind a validation could meet the stated requirements, it is often not permissible to have observed defects during validation activities. To accommodate this additional requirement, the simplest solution is to use a sampling plan with an acceptance number of zero (c=0).
By hand, determine the sample size to attain the needed confidence and reliability (input as decimals) using the following relationship:
Alternatively, a 1 Sample Proportion test (included in most statistical analysis software packages) could be used to reach the same result.
Variables Data
Just like attribute sampling plans, variables data must also meet certain reliability and confidence levels. Unfortunately, there is no simple relationship between sample size and these requirements.
Register to attend the Process and Test Method Validation for Medical Devices Conference! Attend in-person or virtually. Topics include:
|
A common approach for solving this problem is to rely on type B operating characteristic (OC) curves (reference ANSI/ASQ Z1.9 for more details). To use these curves, two main assumptions need to be satisfied: The data must be normally distributed and the lot size must be near infinite in size (such as from a continuous process).1
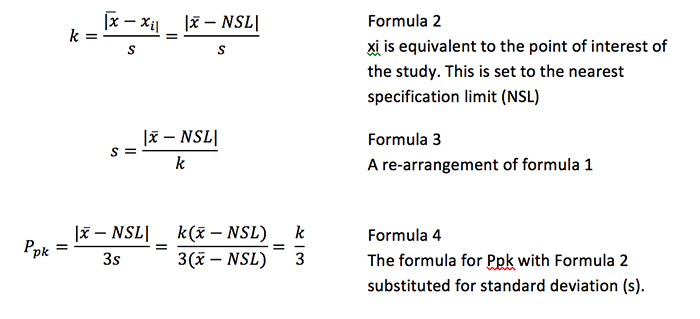
An OC curve is based on three primary characteristics: The probability of acceptance (100% – % confidence), the percent defective (100% – % reliability) and the sample size. A fourth characteristic, the acceptance coefficient (k), is the adjustable acceptance criterion that allows the user to determine the confidence/reliability statement from his or her validation. This factor can be translated directly to the process capability statistic Ppk using Formulas 2-4 for ease of analysis.
The coefficient is related to Ppk per the relationship below.
Every combination of OC curve and acceptance factor results in a different confidence statement. For example, the confidence statement for a combination of sample size and k resulting in a probability of acceptance of 5% for a 10% defective lot, could read as: 95% confidence and 90% reliability.
Given that each sample size has a unique OC curve and that these curves are not linear, using validated software (or verified tables) will be required to assess each sampling plan.
Reference
- Taylor, W.A., Guide to Acceptance Sampling, Electronic Version – First Edition ISBN: 0-9635122-0-X.
Related Articles
-

The UK MHRA has published “Software and Artificial Intelligence as a Medical Device.” The guidance…
-
“Addressing unmet needs across pediatric populations is critical to advancing children’s health, and we are…
-

The MDDT program was developed in collaboration with the National Institutes of Health’s (NIH’s) National…
-

More and more, the quality of real-world evidence (RWE)—gathered from remote patient monitoring data, product…